
Workpackages WP1-WP7
- WP1 - Project Coordination & Management
- WP2 - Providing climate scenarios for Europe
- WP3 - Establishing climate information for non-European regions
- WP4 - Tailoring climate information to the local scale and impact modeling activities
- WP5 - Uncertainties in climate change: impact assessment, decision making and guidance
- WP6 - Impacts and costs: water, energy , tourism, transport and infrastructure
- WP7 - Impacts and costs: forestry, agriculture and ecosystems services
The objectives of this work packages are:
- to provide for effective communication and reporting between the consortium and the European Commission
- to provide for effective coordination, communication, reporting and support decision-making inside the consortium at project and WORK Package levels in order for the IMPACT2C consortium to complete the project on schedule and with the planned resources available
- to provide legal, financial, and management services to the consortium
- to organize Project Steering Committee (PSC) and General Assembly meetings
- to coordinate the cooperation of IMPACT2C with the stakeholder and political dissemination panels
Participants
HZG (lead)
| WP | Lead | Title | Due Date |
| WP1 | HZG | D1.1. Project final report, including project web-site start in month 3 | 30/09/2015 |
The objectives of this work packages are:
The main objective of this work package is to provide climate scenarios for Europe at the time when the global mean temperature is simulated to be 2ºC (1.5ºC) above its preindustrial level. These scenarios will serve as input for the impact studies. This objective is broken down into the following four specific objectives:
Analysis of robust regional climate change patterns at the time when the global temperature exceeds the preindustrial level by 2°C (1.5°C) in a wide range of different scenarios.
Provision of new CORDEX-type regional ~10km resolution climate scenarios by downscaling Atmosphere-Ocean General Circulation Model (AOGCM) simulations under the ENSEMBLES-E1 stabilization scenario and/or under the new RCP-scenarios (Representative Concentration Pathways).
Provision of new high-resolution (~30km) Atmospheric General Circulation Model (AGCM) transient 30-year time slice scenarios centred on the time when the global temperature exceeds the preindustrial level by 2°C (1.5°C). Downscaling of the high-resolution AGCM scenarios to ~5km resolution.
Participants
SMHI (lead)
HZG, UniRes, MET.NO, ENEA, CNRS-IPSL, MeteoF, DMI, KNMI, Met Office
| WP | Lead | Title | Due Date |
| WP2 | CNRS-IPSL | D2.1. Identification of robust climate change patterns in pre-existing scenarios for Europe | 30/09/2012 |
| WP2 | SMHI | D2.2. Climate change information and the creation of an online data Archive | 30/09/2013 |
The objectives of this work packages are:
The main objective of this work package is to provide climate scenarios for Europe and West Africa (Niger Basin), East Africa (Nile Basin), Bangladesh and Maldives at the time when the global mean temperature is simulated to be 2ºC (1.5ºC) above its preindustrial level. These scenarios will serve as input for the impact studies. This objective is broken down into the following four specific objectives:
Analysis of robust regional climate change patterns at the time when the global temperature exceeds the preindustrial level by 2°C (1.5°C) in a wide range of different scenarios.
Provision of new CORDEX-type regional ~10km resolution climate scenarios by downscaling Atmosphere-Ocean General Circulation Model (AOGCM) simulations under the ENSEMBLES-E1 stabilization scenario and/or under the new RCP-scenarios (Representative Concentration Pathways).
Provision of new high-resolution (~30km) Atmospheric General Circulation Model (AGCM) transient 30-year time slice scenarios centred on the time when the global temperature exceeds the preindustrial level by 2°C (1.5°C).
Analysis of sea level rise from CMIP5 results with a focus on the above 4 vulnerable regions.
Participants
MeteoF (lead)
HZG, PIK, UniRes, MET.NO, SMHI, ENEA, DMI, Met Office
| WP | Lead | Title | Due Date |
| WP3 | ENEA | D3.1. Report on climate available information over vulnerable areas based on past experiments | 31/03/2012 |
| WP3 | DMI | D3.2. Creation of online data archive of model output, synthesis report for non-European vulnerable areas | 30/09/2014 |
WP4 interfaces the results from long climate integrations in WP2 and WP3, uncertainty analysis in WP5 and impact modelling requirements of WPs 6, 7, 8, 12, 13 and 14. As part of this processes an investigation of user requirement has been performed.
For this purpose a “user requirement form” has been devised. Results of this user questionnaire have been analysed. The far majority of the requests concern daily data on temperature (daily mean, minimum and maximum), precipitation, longwave and shortwave radiation and humidity (absolute and relative). Some users also requested information on surface winds, pressure (mean sea level as well as surface pressure). A minority of the user also needed other types information, like snow depth, or derived statistics (like number of heatwaves, number of frost days, number of consecutive dry days, changes in extremes precipitation).
There are two modelling streams in IMPACT2C: one based on regional climate model simulations at 25 km resolution from the ENSEMBLES project (the so-called “Fast-track”), and one based on EURO-CORDEX simulations at 12 km resolution (the so-called “Slow-track”). To facilitate the use of the data, all modelling data has been provided to the user community in a common data format (common grid, and time calendar, common meta data).
| RCM | Driving GCM | RCPs |
| CSC-REMO2009 | MPI-ESM-LR | 2.6, 4.5, 8.5 |
| IPSL-WRF331F | IPSL-CM5A-MR | 4.5 |
| KNMI-RACMO22E | EC-EARTH | 4.5, 8.5 |
| SMHI-RCA4 | EC-EARTH | 2.6, 4.5, 8.5 |
| SMHI-RCA4 | HadGEM2-ES | 4.5, 8.5 |
EURO-CORDEX simulations used in IMPACT2C
Systematic errors in the climate models lead to biases in the outcome of model simulations. Many applications (e.g. impact models) require data that is corrected for these model biases, in particular if the impact model is non-linearly dependent on the meteorological input. This is for instance the case if the system is very dependent on whether or not a certain threshold is exceeded for a specific variable. Therefore, large efforts have been made on creating a data set that is corrected for systematic biases.
After this correction indeed the modelled distribution and the observed one match very well over most part of Europe. Bias correction could only be done for variables for which long term gridded observations are available. For temperature (mean, minimum and maximum) we use E-OBS, for radiation we used WFDEI (WATCH forcing data Era-interim, which is a blend between observations and model results). A small effort has been put on correction of surface wind biases for wind power estimates.
The drawback of bias correction is that it may lead to loss of consistency between meteorological variables. E.g., bias correction of temperature implies a correction of absolute humidity or relative humidity or both in order to retain physical consistency. Based on physical arguments, we have chosen to adjust the absolute humidity, and provided this corrected field to the users.
A large data base of processed model results as detailed above has been created, containing 5 processed model results for ENSEMBLES, and 11 processed model results for EURO-CORDEX model results. For each model simulation 23 model fields (corrected as well as uncorrected) have been provided for EURO-CORDEX model results and 18 fields for ENSEMBLES model results.
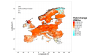
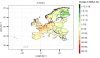
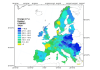
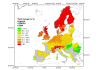
From these processed model data 11 climate change indices have been computed, covering heatwaves, cold spells, and heavy precipitation. In addition, we investigated changes in surface humidity which is an indicator of potential changes in the intensity of heavy showers.
")
Figure 1. Changes in the number of frost days derived from the two RCP2.6 EURO-CORDEX simulations (click image to enlarge)
Participants
KNMI (lead)
HZG, SMHI, CNRS-IPSL, UniGraz
| WP | Lead | Title | Due Date |
| WP4 | KNMI | D4.1. Report on requested meteorological data and climate change indicators | 30/09/2014 |
To enable integrated (climate – impact – cost) assessment of uncertainty in the sectorial climate change impact projections of IMPACT2C (see WPs 7,10,11,14,15,16,17, 8, 9,14,15,16,17, 12, 13, 14). To achieve this objective, climate change uncertainty will be studied in detail and a methodological framework for integrated uncertainty assessment will be established and adapted to the various sectorial applications.
- to enable cross-sectorial synthesis of the sectorial results. To achieve this objective, a reduced subset of the climate scenarios from WP2 and WP3 will defined, which is sufficiently small to be handled by any sectorial impact study on the one hand, and still features sufficient spread to realistically cover climate change uncertainty on the other hand. This common mandatory set of climate drivers will enable cross-sectorial synthesis of the IMPACT2C results (see WP11).
- to develop a method and guidance for integrating decision making under uncertainty within the project, to inform the impacts tasks and subsequent identification and assessment of adaptation options.
To develop method guidance for the impact assessments at the pan-European sectoral level, especially on the combination of climate and socio-economic scenarios, the reporting of results and the analysis of economic costs. It will also develop consistent socio-economic data sets for input to the sector impact assessment, that are internally self consistent. Finally, it will also identify potential cross-sectoral linkages between the impact sectors to link the sectoral analysis together.
Participants
HZG (lead)
PIK, SMHI, ENEA, UniGraz, JR, IIASA, DMI, WU, TUC, PWA, UNIL, SEI-Oxford, MetOffice
| WP | Lead | Title | Due Date |
| WP5 | HZG | D5.1. Report on the definition of IMPACT2C mandatory climate simulations and method applications | 31/03/2015 |
| WP5 | SEI-Oxford | D5.2. Report of methods for decision making under uncertainty and guidance document | 31/03/2015 |
| WP5 | PWA | D5.3.Methods for impact and cross sectoral assessment, socio-economic scenarios and cost calculation | 31/03/2015 |
Project impacts and costs of a global mean temperature increase of 2°C (and 1.5°C) on freshwater, energy and tourism on pan-European level using a detailed multi-model ensemble. The focus will be on water stress, flooding and water resources, defining the possible impacts, the related costs and the uncertainty.
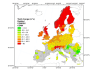
Wind and solar energy in a 2°C warmer climate
In a 2°C warmer climate, the wind power potential in Europe will be altered only to a small extent. Mean energy yields of the European and national wind farms fleets currently operating and projected by 2050 will change by less than 5% in magnitude. Preliminary results from an ongoing study on photovoltaïc (PV) energy also show limited changes in PV power potential and plants yields. Consequently, a 2°C global warming should not undermine nor favor the wind and PV energy development in Europe. However, accounting for local resource changes could help optimize wind and PV power plants management and planning.
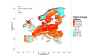
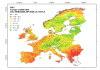
. Robust changes are marked with black dots. (click picture to enlarge) Figure a: Ensemble mean annual changes in 10meters wind speed expected in a 2°C warmer climate, relative to the recent 1971-2000 period (in %). Robust changes are marked with black dots. (click picture to enlarge)")
Figure a: Ensemble mean annual changes in 10meters wind speed expected in a 2°C warmer climate, relative to the recent 1971-2000 period (in %). Robust changes are marked with black dots. (click picture to enlarge) Figure a: Ensemble mean annual changes in 10meters wind speed expected in a 2°C warmer climate, relative to the recent 1971-2000 period (in %). Robust changes are marked with black dots. (click picture to enlarge)
European Union is committed to drastically reducing greenhouse gas emissions : a 40 % reduction target has been set for 2030 as a step toward the 80 % reduction objective for 2050. Renewable energies, in particular wind and solar energy, are intended to occupy a large share in European energy mix. Wind energy already provides more than 30 % of the electricity supply in several countries such as Denmark and its share in the European electricity mix should increase from today's 7 % to 15 % by 2020. The total installed wind power capacity in Europe currently exceeds 100GW and could be multiplied by 3-4 by 2050. Regarding solar photovoltaïc (PV) power capacity, almost 80 GW are already installed and a 500 GW capacity could be exceeded by 2050 according to several energy scenarios (ECF 2010).
However, renewable energies are potentially vulnerable to climate changes, e.g. through changes in large-scale circulations which may alter intensity and patterns of both near-surface winds and cloudiness. In the framework of the IMPACT2C project, the impacts of a 2°C global warming, a level that will be likely reached according to most climate scenarios, on wind and PV energy in Europe have been studied. An ensemble of nine state-of-the-art climate regional projections, made up of five simulations under the scenario RCP4.5 and four under the scenario RCP8.5, have been used.
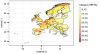
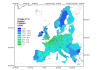
The modeled wind speeds have been converted into turbine-generated power using standard manufacturor power curves at every location in Europe and in particular over turbines currently in operation and projected by 2050 (Tobin et al, 2014). Over most of Europe, changes in near-surface wind speed are projected to be weak and not distinguishable from natural variability (Figure a).
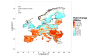
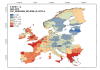
 but for wind power potential. (click picture to enlarge)")
Figure b: Same as a) but for wind power potential. (click picture to enlarge)
Small robust changes (by a few %) are highlighted in some regions. These changes lead to changes in wind power potential which are slighlty stronger but still within +-5 % (Figure b). Slight decreases are projected over the Atlantic and Mediterranean regions, except over the Turkish Western coast where a slight increase is highlighted. A small increase will also occur over parts of the Baltic Sea.
 and the 15 biggest national fleets (cyan) currently installed in Europe, expected in a 2°C warmer climate, relative to the recent 1971-2000 period (in %). The colored wide bars indicate the ensemble mean, the symbols represent individual model changes (the red color indicates significant changes, the blue one are not significant (95 % level)). The thin black bars draw the 95 % confidence interval. (click picture to enlarge)")
Figure c: Future changes in wind power production for the whole European fleet (magenta) and the 15 biggest national fleets (cyan) currently installed in Europe, expected in a 2°C warmer climate, relative to the recent 1971-2000 period (in %). The colored wide bars indicate the ensemble mean, the symbols represent individual model changes (the red color indicates significant changes, the blue one are not significant (95 % level)). The thin black bars draw the 95 % confidence interval. (click picture to enlarge)
The resulting changes in the wind farms mean annual yields are projected by all models to be smaller than 5 % in magnitude at the national and European scales (Figure c). This result applies to current operational wind farms as well as to projected plants by 2050.
Thus, the European future wind energy resources should not be strongly altered by a 2°C global warming. However, these changes, albeit small, might be considered in wind energy planning. In addition, changes in other factors such as land use, aerosols, storms, icing which can also impact wind power production must be studied.
First results from an ongoing study on PV solar energy, using a similar approach, suggest that effects of a 2°C global warming on the PV production will also remain limited.
References
- European Climate Foundation (ECF) (2010). Roadmap 2050 : A practical guide to a prosperous, low-carbon Europe. Volume 1 : technical and economic assessment.
- Tobin, I. ,Vautard, V., Balog, I. and co-authors (2014). Assessing climate change impacts on European wind energy from ENSEMBLES high-resolution climate projections. Climatic Change. DOI : 10.1007/s10584-014-1291-0
Participants
PIK, MET.NO, SMHI, JRC, ENEA, CNRS-IPSL, WU, TUC, PWA, SOTON, GFC
| WP | Lead | Title | Due Date |
| WP6 | WU | D6.1. Maps showing the climate change impacts, at 2°C and 1.5°C for each sector | 30/11/2014 |
| WP6 | SOTON | D6.2. Impacts and costs of sea-level rise, for water, energy, tourism, transport, infrastructure | 31/03/2015 |
• Project baseline impacts of a global mean temperature increase of 2°C on forestry, agriculture and ecosystems services on pan-European level.
• Identify adaptation options for impact assessment of adaptation policies in WP10.
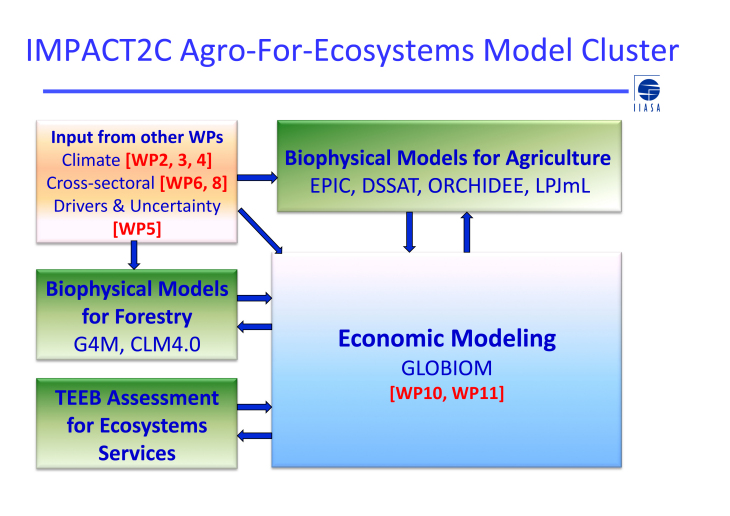
Flow diagram: modelling cluster & link with other WPs (click graphic to enlarge)
Tools

Table 1. Inputs from EURO-CORDEX ensemble
Five process-based ecosystem and generic vegetation models are used: EPIC (IIASA), LPJmL (PIK), CLM4.5 (JRC), DSSAT/SALUS (ENEA) and ORCHIDEE (CNRS-IPSL). In addition, G4M (IIASA) model is used to quantify impacts of +2C global warming on forests and forestry. GLOBIOM (IIASA) – a bottom-up global recursive dynamic partial equilibrium model of the agricultural, bio-energy and forestry sectors – is used to assess impacts and adaptations, and to generate monetary estimates of impact and adaptation costs. The WP7 bio-physical models were coupled with bias-corrected EURO-CORDEX dataset at 0.25° spatial resolution (LPJmL at 0.5°). The input variables from WP2-4 and model requirements are summarised in Table 1, and mandatory simulations for WP7 are listed in Table 2 (agreed at GA 2013, Rome). Model descriptions are provided in Deliverable 7.2.

Table 2. Mandatory EURO-CORDEX simulations
1. Impact of 2C global warming on crop production
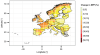
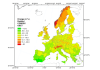
Preliminary simulations with EURO-CORDEX ensemble indicate that +2°C global warming will likely reduce yields of winter crops due to accelerated phenological development. For example, winter wheat yields will decrease by more than 0.5 t/ha in many western and central-European regions. However, changes in precipitation pattern during the growing season may lessen negative effect of temperature in some dry regions. In northern parts, increased growth rates of winter crops during winter and early spring may result in rising yields. Summer crops would be rather negatively affected in the Mediterranean region, but, in general, they will be more yielding at higher latitudes. For example, maize yields may increase by more than 1 t/ha in central and western Europe. Yields of summer crops are likely to increase by more than 70% for at north latitudes (above 55°N), even though the absolute yield may still be quite low. A positive impact by more than 20-40% was simulated for mid latitudes (between 45 and 55° N), with a particularly positive response at higher altitudes. The ensemble-median impacts on yields of selected crops are presented in Fig 1.
Fig. 1. Ensemble-median impact of +2C global warming on rainfed crop yields (in tons of dry matter/ha) calculated by the EPIC model.
2. Impact of 2C global warming on ecosystems
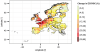
From the ecosystem perspective, the impacts of +2°C global warming on carbon in vegetation and ecosystems, soils, gross primary production (GPP), net primary production (NPP) and net of ecosystem exchange and production have been calculated with CLM4.5. For example, the results with KNMI_RACMO22E_EC-EARTH, RCP4.5 presented in Fig 2 show an overall increase in the amount of carbon fixed by GPP and NPP (an increase by around 10 to 40% in most of the grid cells in Europe) as well as the total fixed in ecosystems, but not in soils (Fig 2d). Soil carbon tends to decrease especially in boreal regions, while it is expected to increase in temperate climates. The baseline simulations show that the atmospheric carbon is stored mainly in temperate deciduous forests and its ecosystems over Central and Eastern Europe.
3. Impact of 2C global warming on selected ecosystem services
We analysed the impacts of +2°C global warming on selected indicators of ecosystem services, namely soil organic carbon (SOC), water storage (including growing season precipitation and ET, annual PET and ET, runoff, and irrigation water) and plant nutrition (plant available phosphates and nitrates).
Global warming is expected to significantly alter the carbon budget and C-related ecosystem services since climate is one of the main forces driving changes in soil carbon. Weather determine soil temperature and water as well as plant biomass and residues, and it all effects SOC stocks and dynamics. It is generally expected that rising temperature will accelerate the SOC decomposition in many European environments, leading to thinning of the SOC stocks in agricultural land (Smith et al., 2005). IMPACT2C ensemble-forced EPIC simulations indicate that SOC will likely be reduced in cropland of Europe, particularly in the Mediterranean region and countries of Eastern and Northern Europe, with a decline by more than 10% in many places (Fig 3a). We also demonstrate that conservative cropland management such as reduced tillage, no-till and crop residue management may counteract these negative effects of climate change (Deliverable 7.2).
LPJmL and EPIC simulations with EURO-CORDEX predict a decrease in ET over the crops’ growing periods in southern Europe (Fig 3b). This can be explained by simulated shorter growing season and lower yields, and also by lower soil moisture. Annual ET decreases less strongly and increases across northern Europe: this pattern basically follows the simulated changes in PET. Modelled runoff changes show more distributed patterns, with regions of positive change alternating with regions of negative change (Fig 3c). These runoff changes mainly mirror the scenario-specific changes in precipitation but also the general temperature increase. The adverse changes to water availability partly explain the adverse changes in crop yields reported above. As a corollary to changing (potential) ET and runoff, irrigation water use is simulated to change in many areas – with predominantly decreasing water use, due in particular to reduced growing periods but also due to aggravated water limitations that do not allow for further use (see WP6).
Nitrogen and phosphorus are pivotal for the functioning of bio-geochemical cycles and thus for long-run soil fertility service. The lack of N and P may lead to serious limitations in crop production and ecosystem services, such as it may prevent agro-ecosystems from acting as carbon sinks or realizing their climate-related potential to be enhanced. In intensified agricultural systems, N and P are being supplied through chemical fertilizers or manure. Assuming constant application rates over time, the total soil nitrates will likely decrease relative to present days in almost all cropland, and especially in Eastern Europe (Fig 3d). It mainly corresponds with an overall decline in SOC and increased leaching, especially under less-effective nutrition supply from crop management. Since N and P concentrations are strongly driven by fertilizer inputs, the pattern may significantly change depending on producers’ practices and adaptations.
4. Uncertainties and robustness of the impact assessment
In addition to the impact assessment we also focus on uncertainties/robustness of impact signal propagated from the ensemble. Simulations with EURO-CORDEX data revealed large variability in simulated yields when analysed across climate models and projections, implying a serious source of uncertainty. The uncertainty is especially profound for rainfed systems in the Mediterranean region. As an example, animations in Fig 4a,b illustrate differences in simulated maize yields at 2C period and yield changes relative to the historical period for seven EURO-CORDEX scenarios. As proposed in WP5, the impact robustness is based on the agreement between the climate scenarios, meaning that if 66% of scenarios have all positive or all negative impacts on future yields, projected impacts demonstrate high level of robustness (Fig 4c,d).
5. Drought vulnerability and risk
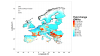
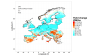
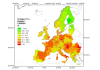
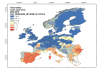
Increased frequency of drought events under +2C warming will make crop production more vulnerable and will increase risk of yield losses. We used the Probability Risk Analysis (PRA, van Oijen et al. 2013) to estimate vulnerability of crops to extreme drought and to quantify expected risks of yield losses. The drought was defined using the Standardized Precipitation Evapotranspiration Index (SPEI, Vicente-Serrano et al., 2010) as SPEI values being less than –1. The monthly SPEI is based for each region on the local long-term frequency distribution of precipitation and potential ET and is therefore a localised measure of drought. For every grid cell the average SPEI over 1970-2100 is zero and values less than –1 are considered dry extremes. We averaged SPEI from April to September to better represent main growing season. For example, Fig 5 demonstrates high frequency of dry years in the Mediterranean region when CSC_REMO2009_MPI-ESM-LR, RCP4.5 scenario is considered.
Probability (P) of extreme drought was calculated for NUTS2 regions as the fraction of the 30 years (around 2C) with SPEI lower than –1. Vulnerability (V) of crop yields was calculated as the difference in median yields between normal and dry years, while the risk of yield losses equals V * P. With PRA we provide a quantitative definition (in t/ha) of yield vulnerability to drought events, and the risk of yield losses at NUTS2 level.
For CSC_REMO2009_MPI-ESM-LR, RCP4.5 scenario, for example, the drought vulnerability of rainfed maize is more than 2 t/ha in most of the Mediterranean regions, with the production risk of more than 0.5 t/ha (Fig 5).
Fig. 5. (a) Mean SPEI calculated for the +2C period, (b) probability of extreme drought at around +2C, (c) drought vulnerability of rainfed maize yields, and (d) risk of maize yield losses calculated for NUTS2 regions (CSC_REMO2009_MPI-ESM-LR, RCP4.5).
6. Cost assessment
")
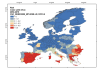
Fig. 6. Definition of GLOBIOM regions, and overall aggregated biophysical impact of climate change in various European regions. (click picture to enlarge)
Monetary estimates of impact and adaptation costs have been framed with GLOBIOM. The overall impacts of climate change on crop production was stratified by major market regions covering Europe in GLOBIOM, and converted into changes in total vegetal calorie supply from crop activities, if excluding adaptations other than changes in sowing and harvesting dates and adjustment in input level within boundaries of existing management systems (Fig 6). These impacts were reframed into a larger context, as European agriculture is to a large extent connected to international markets, which will be affected by local biophysical impacts on other regions.
The relative gain of Europe is better highlighted once compared to other main world regions (Fig 7, HadGEM2-ES, RCP8.5): the aggregated impact is negative at global scale (-4%), and alongside with Europe only a few regions have positive regional impacts (Middle-East and Northern Africa MENA, Community of Independent States CIS, and Oceania OCE). Other regions face moderate (Latin and Central America LAM, Sub-Saharan Africa SSA, Eastern Asia EAS and Southern Asia SAS) to more dramatic (Northern America NAM, South-Eastern Asia SEA) negative overall impact on crop yields. This should to a large extent participate to shape adaptation decisions in Europe, as producers should overall face better market conditions.
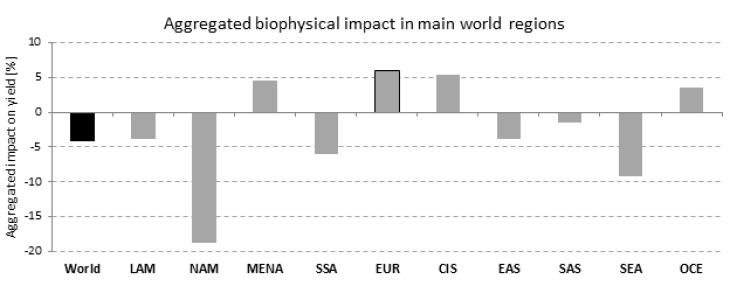
Fig. 7. Aggregated climate change impacts on crops in main regions of the world for +2C scenario (HadGEM2-ES, RCP 8.5) (click picture to enlarge)
For impact cost estimates we rely on conceptual definitions developed in IMPACT2C (Deliverable 5.3, Methods for impact and cross sectorial assessment, socio-economic scenarios and cost calculation). For the agricultural sector, cost and impact estimates were directly driven from the GLOBIOM model outputs using a social welfare approach. GLOBIOM provides an estimate of the social welfare related to land-use activities, as the sum of surpluses of producers involved in the provision of related goods and consumers that consume them. The difference of this metric between two scenarios incorporates in particular two important information that usually vary in opposite directions: the way producers would value the overall changes (as a change in gross margin, i.e. producer surplus), and the way consumers would the value same changes (as a change in food expenditure compared to what they would be willing to pay for the same quantity, i.e. consumer surplus).
Welfare is then defined as the sum of consumer and producer surplus for a given geographic scale. We also account for socio-economic changes between now and the +2°C time horizon, independently from the climate change (baseline scenario). Consequently, we define the monetary impact of climate change as the difference in European welfare gain from 2010 to 2030 (+2°C time period for this example) between the baseline scenario and the baseline with a +2°C climate change scenario after adaptation. The impacts before adaptation are evaluated for two different assumptions. First, we run a baseline simulation with climate change biophysical impacts, in which we constrained all supply-side variables to take the same values as they would have for the baseline without climate change. Second, we do the same while in addition constraining in a similar fashion the endogenous trade variables. Theses ‘no-adaptation’ scenarios describe a situation in which there is no adaptation of production systems through changes in management, localization, specialization etc… but we still allow trade (for the first scenario only) and demand to adjust.
At European scale, the welfare from land-use activities would increase by 70.78 billion US$2000 per year between 2010 and 2030 without climate change. For the +2°C scenario, this welfare gain would be of +71.34 billion US$2000 per year with adaptation, but of +68.82 billion US$2000 per year without supply-side adaptations, and +63.83 billion US$2000 per year in case both supply-side and trade adjustments do not occur.
Climate has thus overall positive monetary aggregated impacts on land-use related sectors in Europe of +0.56 billion US$2000/year with adaptation, but a loss of 1.96 to 6.95 billion US$2000/year without adaptation. Fig. 9 presents the same numbers for the various European regions, normalized by number of inhabitants (and expressed in 1000.US$2000 per year per capita).
")
Fig.9. Measuring costs of climate change. (click picture to enlarge)
References:
- Smith, J., Smith, P., Wattenbach, M., Zaehle, S., Hiederer, R., Jones, R.J.A., Montanarella, L., Rounsevell, M.D.A., Reginster, I., Ewert, F., 2005. Projected changes in mineral soil carbon of European croplands and grasslands, 1990-2080. Glob. Change Biol. 11, 2141–2152. doi:10.1111/j.1365-2486.2005.001075.x
- Van Oijen, M., Beer, C., Cramer, W., Rammig, A., Reichstein, M., Rolinski, S., and Soussana, J.-F., 2013. A novel probabilistic risk analysis to determine the vulnerability of ecosystems to extreme climatic events, Environ. Res. Lett., 8, 015032, 1–7.
- Vicente-Serrano, S. M., Begueria, S., and Lopez-Moreno, J. I., 2010. A multiscalar drought index sensitive to global warming: the standardized precipitation evapotranspiration index, J. Clim., 23, 1696–1718.
Participants
IIASA (lead)
PIK, JRC, ENEA, CNRS-IPSL, PWA
| WP | Lead | Title | Due Date |
| WP7 | IIASA | D7.2. Report on modeling results (including maps) and adaptation options | 31/05/2014 |